PowerOptimal, a leader in innovative sustainable energy and demand management solutions, has announced that it has partnered with the South African subsidiary of Swedish global appliance giant Electrolux, to bring cost-effective, sustainable solar photovoltaic (PV) water heating solutions to the South African market.
This exclusive partnership will see the PowerOptimal’s Elon solar PV water heating technology sold alongside Electrolux’s leading Kwikot Superline electric water heaters (geysers). With deployment of the PowerOptimal Elon range, a customer can add solar capability to most standard electric geysers, without the need for an inverter or battery. It is the most straightforward and most convenient means to take advantage of solar and traditional power in an existing solution.
“We are very pleased to announce our partnership with PowerOptimal. The company’s sustainable energy solutions align perfectly with our global commitment to sustainability, which is to shape living for the better”, states Mark Moyce, National Sales & Marketing Director at Electrolux South Africa. “By including the Elon into our range of water heating solutions, we are offering developers, builders and all users of geysers a means to take advantage of the abundant solar resource we have in this country at a fraction of the cost.”
According to both parties the partnership makes perfect sense, as the organisations are an excellent cultural fit, the technologies integrate seamlessly, and the technical excellence from both are providing a superior technology solution designed to support and grow mass adoption of sustainable energy.
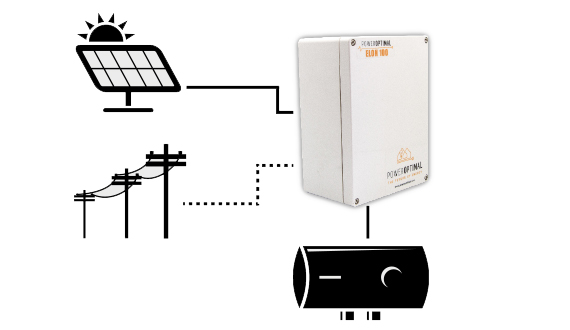
The innovative PowerOptimal Elon range enables direct connection of solar PV panels to standard electric geysers. It requires no inverter and no batteries, is cost-effective, offers a long lifespan and requires almost no maintenance, making it one of the lowest cost per unit of energy (kWh) solutions for water heating available on the market today.
“We are honoured to partner with Electrolux. The company’s market coverage, quality standards, and market-leading customer service make them the perfect partner for our Elon solution,” states Richard Fearon, CEO at PowerOptimal. “Through this exclusive partnership, all PowerOptimal water heating solutions will be recommended and exclusively sold by Electrolux in South Africa. Together we are looking forward to leveraging the technical capabilities of both companies to bring sustainable energy to a larger market of people, previously inhibited by the sheer cost of solar PV technology.”
PowerOptimal’s Elon range solution can run entirely off the grid, or with grid AC power as backup. In addition, it can be used by property developers for conformance to SANS 10400-XA’s Regulation XA2, which requires that at least 50% of the annual water heating requirement for all new buildings shall be from a source other than grid electricity.
###
About PowerOptimal
PowerOptimal designs, develops and builds sustainable energy solutions that redefine the future of energy. Headquartered in South Africa and founded in 2014, PowerOptimal’s team draws from their collective engineering and commercial expertise to enable global organisations and consumers to reduce energy cost whilst achieving the sustainability goal of net zero carbon. The company’s innovative and patented energy demand management and solar photovoltaic water heating systems are designed to reduce consumption, demand and cost by leveraging the abundant solar resource.
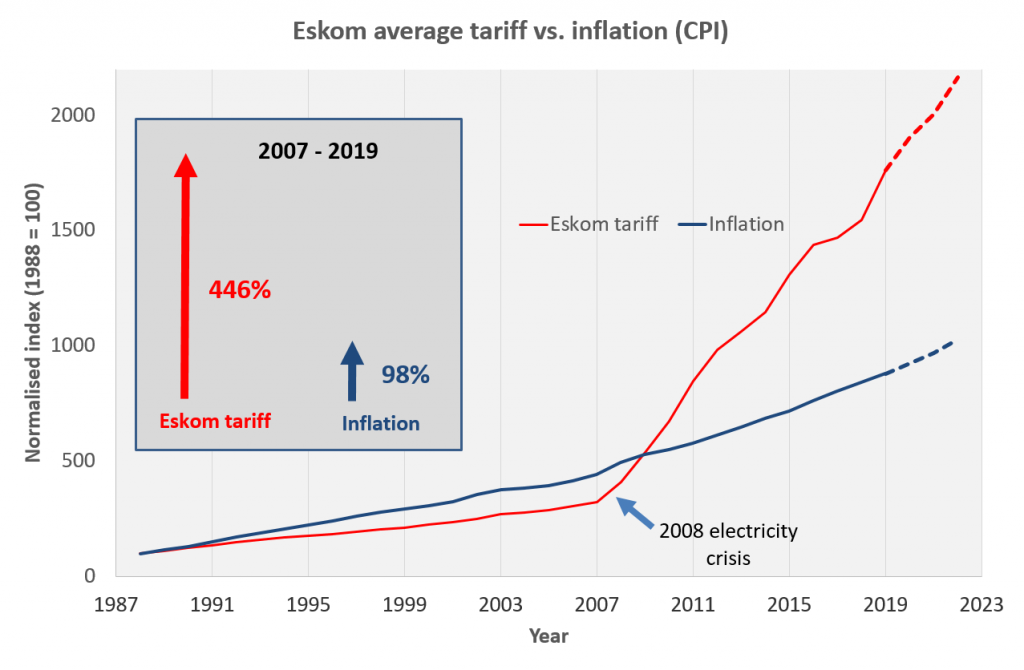
The graph below shows the Eskom tariffs from 1988 to 2019, plotted against CPI (Consumer Price Index) or inflation over the same period. It also shows projections up to 2022, based on currently projected increases as approved by NERSA (8.1% in 2020 and 5.2% in 2021), as well as Stats SA and the Bureau for Economic Research’s inflation projections.
Note: The graph depicts overall average increases – actual increases will be different for different types of consumers (residential, commercial and industrial) and will vary between municipalities.
Looking at the graph, the following can be noted:
In the period from 1988 up to the 2008 electricity crisis, electricity tariff increases did not keep tread with inflation. This was partly due to government policy to keep electricity tariffs as low as possible for poor communities, but also due to Eskom having an oversupply of electricity (in the 1990’s) and not investing in new capacity (in the 2000’s).
Between 1988 and 2007, electricity tariffs increased by 223%, whilst inflation over this period was 335%.
From the 2008 electricity crisis onwards, there is a clear and sharp inflection point for electricity tariffs in South Africa. From 2007 to 2019, electricity tariffs increased by 446%, whilst inflation over this period was98%. Thus electricity tariffs increased more than four-fold in 12 years.
Based on the currently approved increases for 2020 and 2021, the total increase in electricity tariffs from 2007 to 2021 will be 520%. By then, electricity tariffs would have increased more than5-fold in 14 years.
Considering the current serious state of Eskom’s debt and the fact that the country probably cannot afford for Eskom to fail, consumers can likely expect a continuance of much higher than inflation electricity price increases over the next several years. Eskom is in serious need of restructuring, but this is likely to face strong resistance from the trade unions.
Electricity prices in South Africa have dramatically outpaced inflation over the past decade (ever since the 2008 electricity supply shortage crisis). Recently, Eskom has won a court case allowing it to recover historical ‘losses’ or under-recoveries (the so-called regulatory clearing account or RCA).
Please note: we have published an update to this article in 2019 with more recent Eskom price increase data. Please see the article here.
After a brief respite in 2017 (when an increase of only 2.2% was granted by NERSA, the National Energy Regulator of South Africa), Eskom has submitted an application to NERSA for a 19.9% electricity tariff increase in 2018, and might still add additional RCA applications.
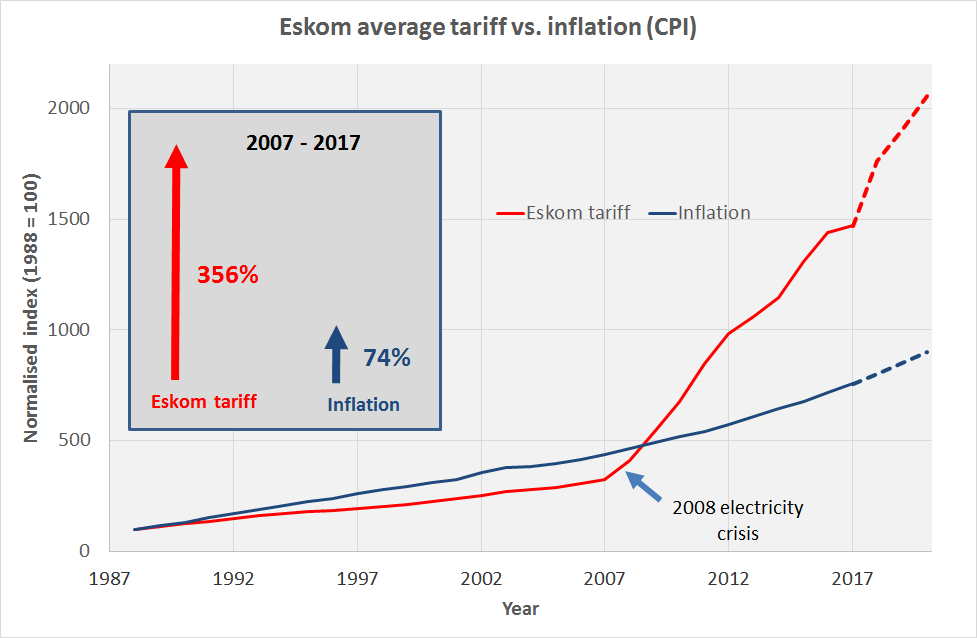
Below is the Eskom tariffs from 1988 to 2017, plotted against CPI (Consumer Price Index) or inflation over the same period. The dotted lines are projections over the next 3 years, based on Eskom’s 19.9% application for 2018, and further increases of 8% in each of 2019 and 2020 (this could be much higher if further RCA recoveries are granted).
Over a period of 10 years, Eskom’s electricity prices have increased by about 356%, whilst inflation over the same period was 74%. This means that electricity prices have increased 4 times faster than inflation over this period. Whilst South Africa had some of the least expensive electricity in the world in the early 2000’s, the question now is: how expensive is electricity in South Africa compared with the rest of the world in 2017?
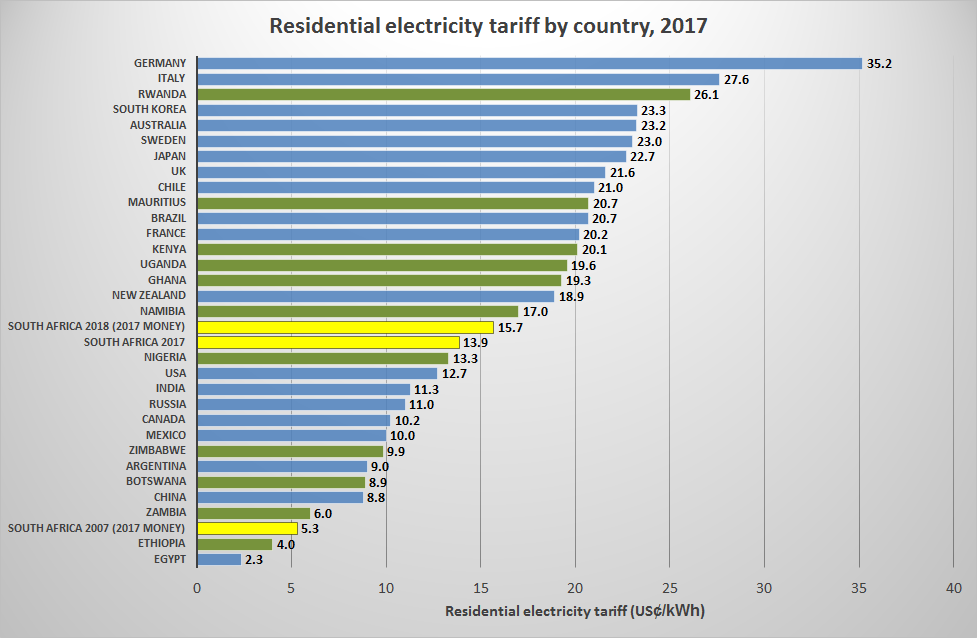
We decided to investigate. The graph below shows 2017 residential (household) electricity prices for a selection of developed and developing countries in US dollars. South African prices for 2007, 2017 and 2018 (all in 2017 money) are indicated in yellow, and other African countries are indicated in green. (Note: most countries have a range of residential tariffs that vary according to use, location and other factors. The tariffs in the graph are based on a middle-class urban household with consumption of 400 kWh of electricity per month.)
As can be seen from the above graph, whilst South Africa used to be one of the least expensive countries in the world in terms of dollar price of electricity, this is no longer the case. It is now mid-range in terms of electricity price for the countries in the comparison.
Most of the African countries with less expensive electricity than South Africa (such as Botswana, Zambia, Zimbabwe and Ethiopia) have substantial government subsidies. Of course these countries typically also have a much less reliable electricity supply than South Africa.
Also to be noted is the high price of electricity in many developed countries.
However, the above is not the full picture. The typical income of a citizen of each of these countries varies tremendously. This impacts directly on the affordability of electricity in each country.
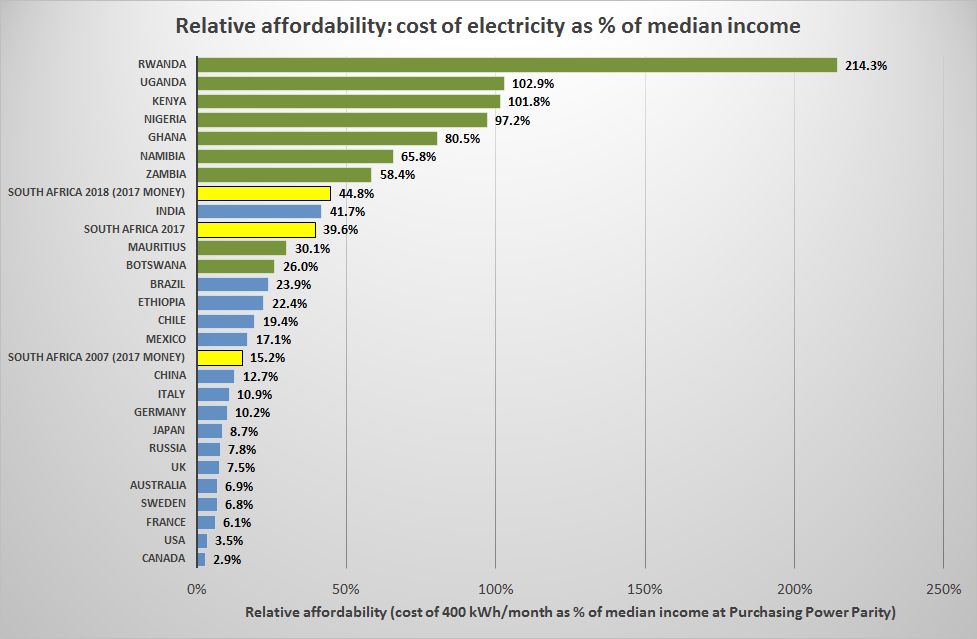
It is thus more appropriate to look at affordability of electricity as a function of the typical or median income of citizens in order to make a comparison. The below graph shows the cost of 400 kWh/month of electricity as a percentage of the median income per capita in each country (at purchasing power parity). This is a much better indication of relative affordability of electricity in each country. (Note: median income = that income where half of the people earn more and half of the people earn less. This is a better representation of the typical income than the “average” income, since averages are distorted more by extreme values or outliers.)
The following interesting observations can be made from the graph:
Disparities in electricity affordability are larger than only the dollar tariff would indicate – whereas the ratio of highest to lowest dollar tariff is 15, the ratio of highest to lowest relative cost is 75;
Electricity is most affordable in developed countries;
Electricity is least affordable in African countries;
Electricity in South Africa is still relatively more affordable than many other African countries;
Affordability of electricity in South Africa has decreased over the past decade and is continuing to decrease;
Following the possible 19.9% increase in 2018, South Africa’s electricity will be the least affordable of the BRICS countries.
References
Source for exchange rates (as of 27/09/2017): https://www.oanda.com/currency/converter/
Source for median income per capita: https://www.givingwhatwecan.org/post/2016/05/giving-and-global-inequality/
http://global-climatescope.org/en/country/chile/#/details and http://www.ees-magazine.com/chile-large-scale-batteries-now-home-storage-later/ and https://www.cne.cl/wp-content/uploads/2016/07/AnuarioCNE2015_vFinal-Ingles.pdf
http://www.hindustantimes.com/india-news/55-increase-in-bihar-power-tariff-from-apr-1/story-uZF2x5pX7xauEysMDGN6aL.html and http://www.thehindubusinessline.com/news/8-power-tariff-hike-for-all-categories-of-consumers-in-karnataka/article9629593.ece and https://cp.tatapower.com/irj/go/km/docs/documents/Public%20Documents/CustomerPortal/pdf/Direct.pdf
Please note: this article has been updated – click here for the 2021 version.
With the rapid increase in the price of electricity and water over the past few years, the question is: what does a shower or bath cost in South Africa in 2017?
Most South Africans are aware of the rapidly rising price of electricity (a 300% increase in the period 2007-2015 alone), but the price of water has also been increasing rapidly over the past few years.
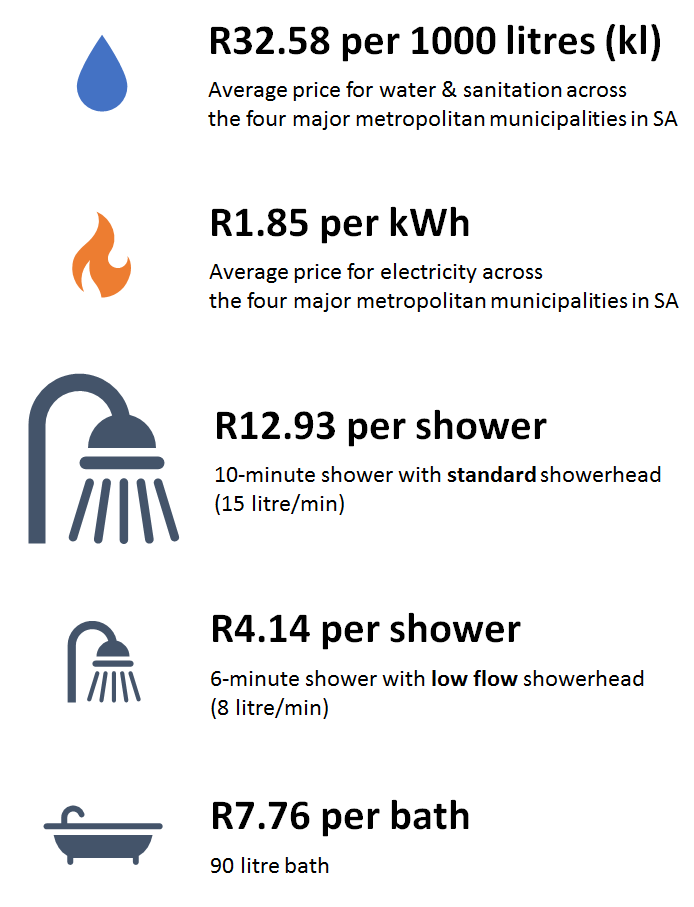
For example, here are the water & sanitation tariff increases effective July 2017 for the four major metropolitan areas:
Ethekwini 17%
City of Johannesburg 12.2%
City of Tshwane 10.2%
City of Cape Town:
13.2% for 6 – 10.5 kl (kilolitres)
29.7% for 10.5 – 20 kl
27.2% for 20 – 35 kl
128.8% for 35 – 50 kl
These increases are all much higher than inflation. All these municipalities have also done away with the free water allocation of 6 000 litres (6 kilolitres), except for people registered as indigent.
Of course, there is a serious drought in Cape Town, and so the increases seen there might be more justifiable.
South Africans tend not to think twice about the cost of a shower or bath, since both electricity and water used to be very inexpensive.
Is this still true in 2017? We did some calculations and the result is an eye-opener.
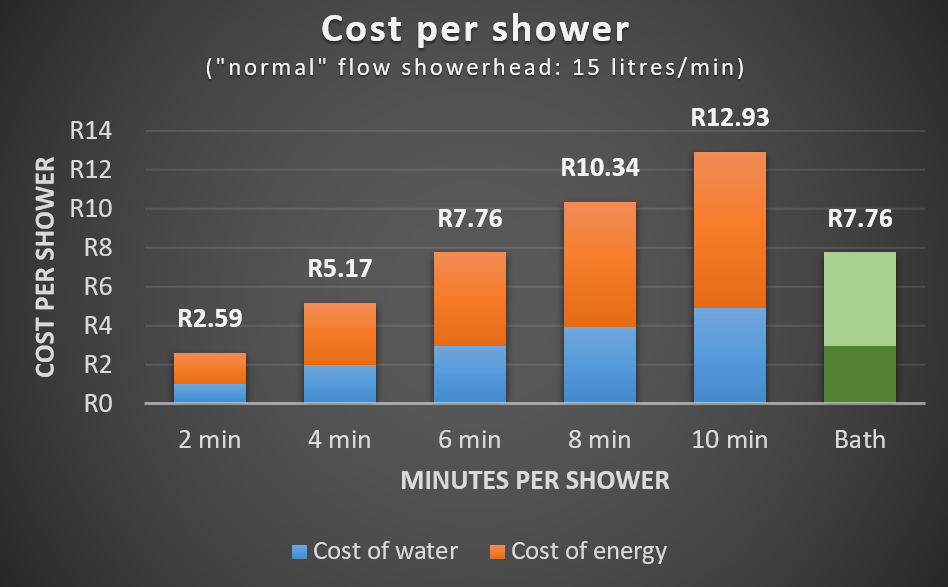
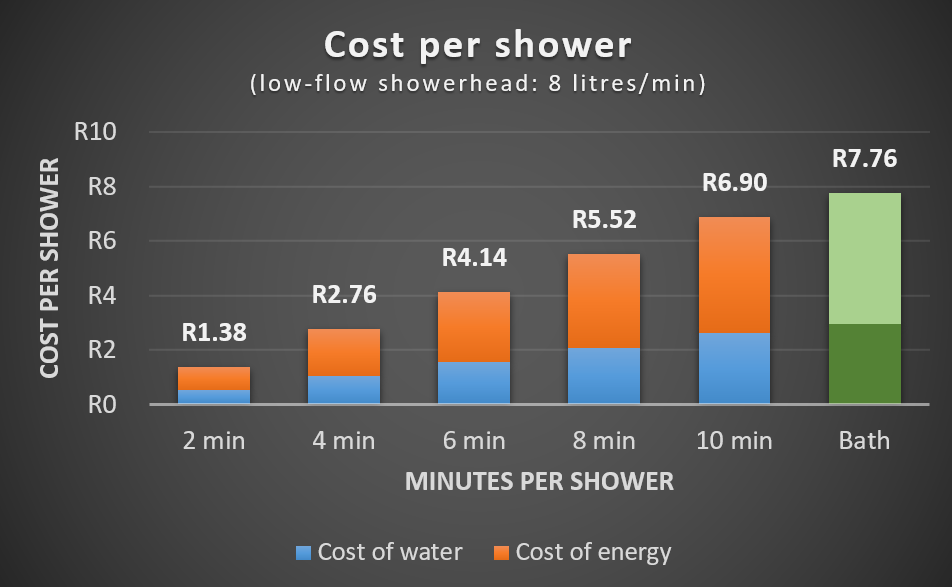
For an average middle-class household in South Africa (LSM7-10), a 10-min shower costs almost R13 if you have a ‘standard’ 15 litre/min showerhead! This is about R1.30/min. By changing to a low-flow showerhead and reducing shower time to 6 minutes, you can dramatically reduce this to just over R4 per shower (or 70c/min).
In either case, it appears that the days of ‘cheap’ showers are numbered, and we can all do with being more aware of just how much water & electricity we use in the shower or bath.
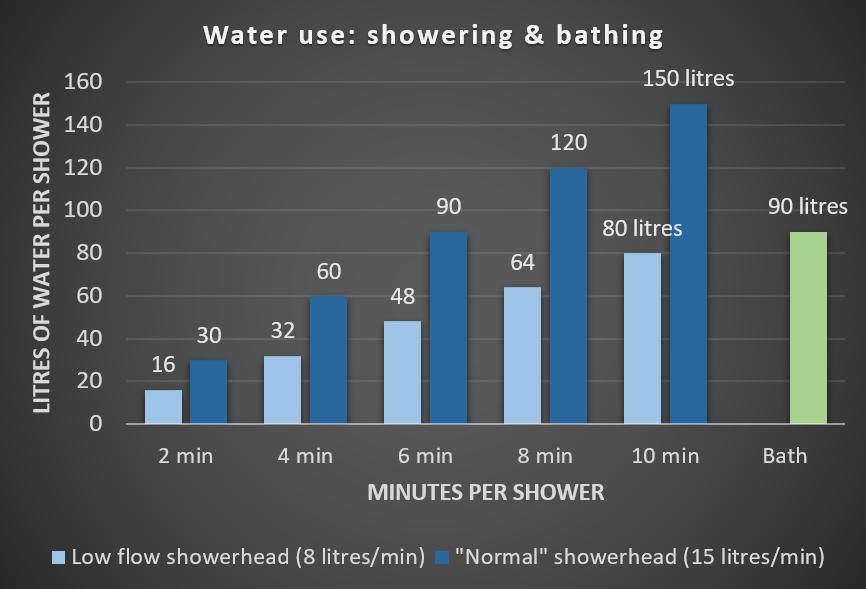
Conventional wisdom has it that showering uses less water than running a bath. However, a typical bath uses 90 litres of water, so if you shower for longer than 6 minutes with a ‘standard’ showerhead, you will actually use more water than if you had a bath… With an average shower time internationally of 8 minutes, a shallow bath might actually be better for your pocket and the environment!
Of course, even better than a shallow bath is to switch to a low flow showerhead and have shorter showers… City of Cape Town recommends showering for less than 2 minutes, and switching to low-flow showerheads (less than 10 litres/min) is compulsory according to City of Cape Town bylaws.
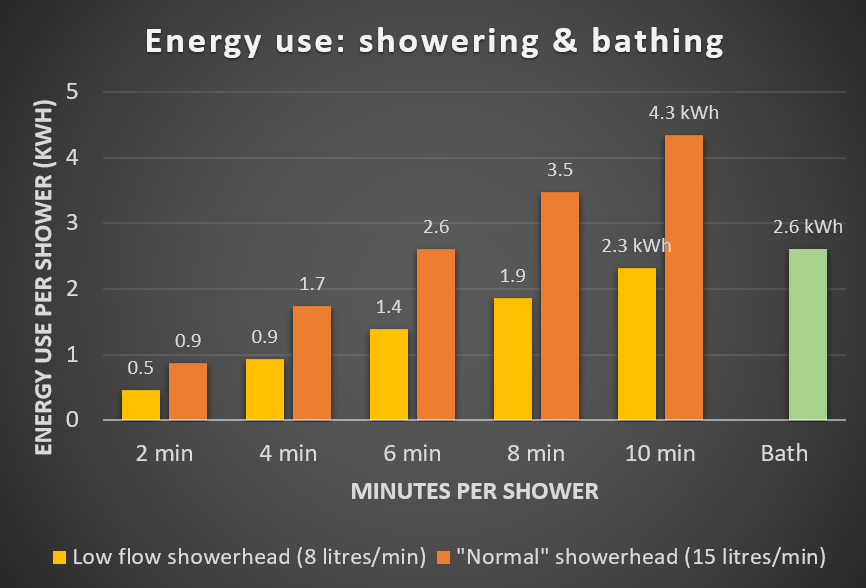
The graphs below show more detailed information on water & energy use and cost per shower for normal & low-flow showerheads, and compared to a ‘standard’ 90 litre bath.
References, methodology & assumptions for calculations
Average bath uses about 90 litres of water. Waterwise. Last accessed: 12/09/2017.
“Normal” or standard showerheads use 15 litres of water per minute or more, and low flow showerheads use about 8 litres water per minute. Eskom fact sheet on showerheads. Last accessed: 12/09/2017.
Average effective residential water & electricity tariffs were calculated from the published 2017/18 tariffs of the following four metropolitan municipalities: City of Johannesburg, City of Tshwane, City of Cape Town and Ethekwini, using the average residential water and electricity consumption values for LSM7-10 obtained from the above references.
For ‘lower income’ households, the average water & electricity tariffs are somewhat lower across the four municipalities (due to lower average consumption), at R1.65/kWh for electricity and R23.47/kilolitre for water & sanitation. This yields a cost per bath of R6.42, a cost per 10-minute ‘normal showerhead’ shower of R10.70/shower, and a cost per 6-minute low-flow showerhead shower of R3.40/shower.
Energy cost of hot water based on heating water from 15 to 60°C, which requires approximately 5.22 kWh per 100 litre.
One thing is certain: the energy industry is undergoing rapid and dramatic change, and mostly to our collective benefit!
There are too many developments to mention, but here are a few of the most interesting from the last few weeks:
The UK (2040) and France (2040) have both joined Germany (2030), Norway (2025), the Netherlands (2025) and India (203) in announcing plans to completely ban petrol & diesel vehicle sales. This is driven partly by renewable energy and climate change goals, but the main concern is actually nitrogen oxide pollution and its negative health effects on urban populations.
These developments will provide further impetus to the growth of electric vehicle sales. Bloomberg New Energy Finance predicts that over half of all new car sales will be electric by 2040. They also predict that electric vehicles will cost less than internal combustion engine vehicles by 2025 – 2029 in most countries.
That should make Tesla’s shareholders happy! What is also making them happy, is Tesla securing an order from South Australia for the world’s largest lithium ion batteryof 100 MW. The battery will be paired with a Neoen wind farm.
Speaking of wind farms, it seems that two-bladed wind turbines are much more cost-effectivethan three-bladed turbines. A slightly lower efficiency (about 2% lower) is more than off-set by an approximately 50% reduction in total cost of energy (capital & operating cost) over the lifetime!
And a floating wind farmhas been proposed off California’s coast, where a steep continental shelf makes traditional underwater foundations for offshore wind farms prohibitively expensive.
Fossil fuel power generation continues to experience headwinds. A large Mississippi flagship clean coal project is experiencing large cost overruns(their US$2.4bn budget is heading to US$7bn!), putting the feasibility of clean coal in question.
The fact that even in the USA coal and nuclear power projects continue to experience huge cost overruns should be a major red flag for South Africa’s nuclear power plant ambitions. Let’s hope that the powers that be start accepting our inevitable solar future!
Until next time
The PowerOptimal team
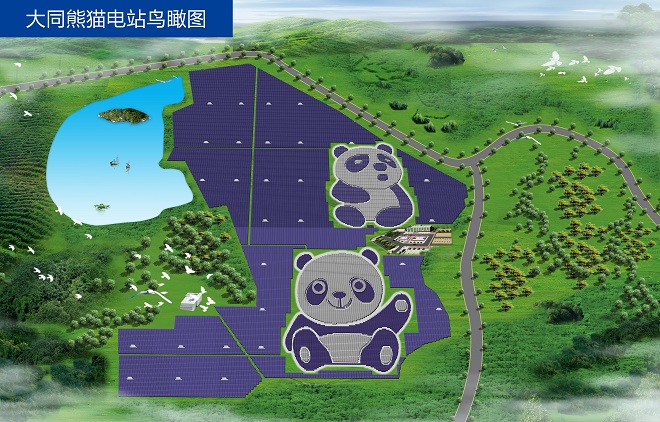
Image below: China’s Panda Green Energy Group has been creative with a new 100 MW solar farm…
The “electron economy” refers to a global shift towards using electricity as the main energy carrier. The term was coined in 2006 by Ulf Bossel, a fuel cell engineer and entrepreneur. In 2007, Michael Hoexter neatly summarized the electron economy concept based on Bossel’s ideas in a blog article that is unfortunately no longer accessible on the internet:
“Electricity, it turns out, is a highly efficient and flexible carrier of energy.
Electric motors are highly efficient energy conversion devices (85 to 95% efficiency vs. 15-25% for typical gasoline engines).
Newer (hydrogen) and older competitors (fossil fuels) to electricity are less efficient and/or have environmental drawbacks.
We already have over a century of experience with electricity.
Renewable energy sources (wind, sun, tides, geothermal heat) can usually most efficiently be converted to electricity rather than to other carriers like biofuels (solar cells, though currently expensive, are up to 400 times more efficient in converting sunlight into energy than plants).
We should focus on transitioning to a largely electric energy infrastructure with the probable exception of fuels for aviation and shipping, where biofuels will have advantages.
Increasing the energy-to-weight ratio and usefulness of electricity storage devices (batteries, etc.) is largely a technical and economic issue that will change for the better, as has been already witnessed in the portable electronics industry. Setting today’s battery capacity as an upper-limit to what can be done with batteries and electricity storage is a political move, not based on reasonable expectations for even modest technological improvements.
Even an economy fueled in part by fossil fuels can be made less environmentally damaging by increased use of electricity as an energy carrier and using electric energy conversion devices like electric motors.Using fossil fuels in highly efficient fuel cells and combined-cycle power plants to generate electricity is second-best to electricity generated by renewable sources but may play transitional roles to a carbon-neutral economy.”
The above seems to be quite prescient today (about 10 years later), in light of the rapid growth in recent years in renewable and electricity storage technologies (such as batteries and fuel cells). You can learn more about the electron economy from a slideshow by Prof. Robert Cormia that you can find here.
The International Energy Agency indicated just last month that it has significantly increased its five-year renewable growth forecast, following a record year for renewables in 2015. For the first time, more than half the new power capacity added globally in 2015 was renewable. Some staggering numbers:
About half a million solar panels were installed every day in 2015
In China, on average two wind turbines were installed every hour in 2015
The spectacular growth in renewables is partly due to regulation and partly due to the rapidly decreasing cost. It is also driven by commitments to move towards deriving 100% of their energy use from renewables by large corporates such as Walmart and Amazon.
On the electric vehicle front, the 2016 Paris Motor Show confirmed a clear shift towards electric vehicles (EVs) by most major car manufacturers. And in a first for Africa, the City of Cape Town will be adding 11 electric buses to its MyCiti Bus Rapid Transit fleet!
Even the South African government is starting to feel the winds of change blowing: in a very recent presentation on the latest draft of the Department of Energy’s Integrated Resource Plan, nuclear build is now pushed out to come online only in 2037 (vs the previous 2029), and renewables are given a bigger role. The draft will be published for public comment.
The Department of Energy’s own Ministerial Advisory Committee on Energy recently released a report that indicated that the least cost scenario for South Africa’s future energy production includes NO new nuclear, and mostly renewables with natural gas as peaking capacity. (You can read more on the analysis here, and find a detailed presentation here.)
While SA seems stubbornly focused on coal (including new private coal-fired power stations), gas and nuclear, Germany is forging ahead with its bold moves to transform into a country with 100% of its energy provided by sustainable and renewable sources.
Already a world leader in incorporating renewables into its national grid through its ‘Energiewende’ programme (with renewables at one point in May 2016 reaching over 90% of the total German power consumption), Germany is not slowing down. In early October, Germany’s Bundesrat adopted a resolution to ban petrol- and diesel-powered vehicles by 2030!
Meanwhile, in South Africa (a country with an embarrassingly rich solar resource compared to Germany), Eskom complains of problems managing and integrating a lowly 2.2% renewables (solar and wind – as of first half 2016) into the SA national grid, and has even signaled an unwillingness to sign further power purchase agreements (PPAs) with independent power producers. (Recently, the SA Wind Energy Association, SAWEA, has lodged an official compaint with NERSA, the National Energy Regulator of SA, over Eskom’s refusal to sign further PPAs.)
Yes, renewables are intermittent and unpredictable (actually predictably unpredictable and eminently manageable over bigger time scales and geographical spreads!), but through good planning, judicial use of energy storage (the cost of which continues to come down at a brisk pace) and distributed generation, these problems can be overcome and renewables can deliver a very high percentage of total energy production. (According to a July 2016 CSIR and Fraunhofer study, up to 65% solar and wind energy generation share can be achieved in South Africa without any additional storage or significant excess energy / curtailment!).
Experiencing pushback from National Treasury about the immense R1 trillion or more bill for the planned nuclear deal, the Department of Energy has now announced that Eskom will finance the whole programme itself, neatly bypassing the need for Treasury approval. The question is: if (when?) Eskom gets into financial trouble later on, who will have to bail them out? Treasury may be forced to do it at that stage to keep the lights on. (And this means WE, the taxpayer, will ultimately pay.)
These troubling developments are happening at the same time as SA is being praised (deservedly) as a world leader in renewable adoption (see e.g. articles here, here and here). As always we seem to manage to be the best and the worst at the same time! What is certain is that interesting times lie ahead in the business of energy in South Africa…
PLEASE NOTE: This article is from 2015. Current status (2021): If financed via a home loan, solar PV plus storage is less expensive than buying electricity from your municipality in South Africa. According to this research by Sustainable Energy Africa, this was already the case in 2019 for middle-income households.
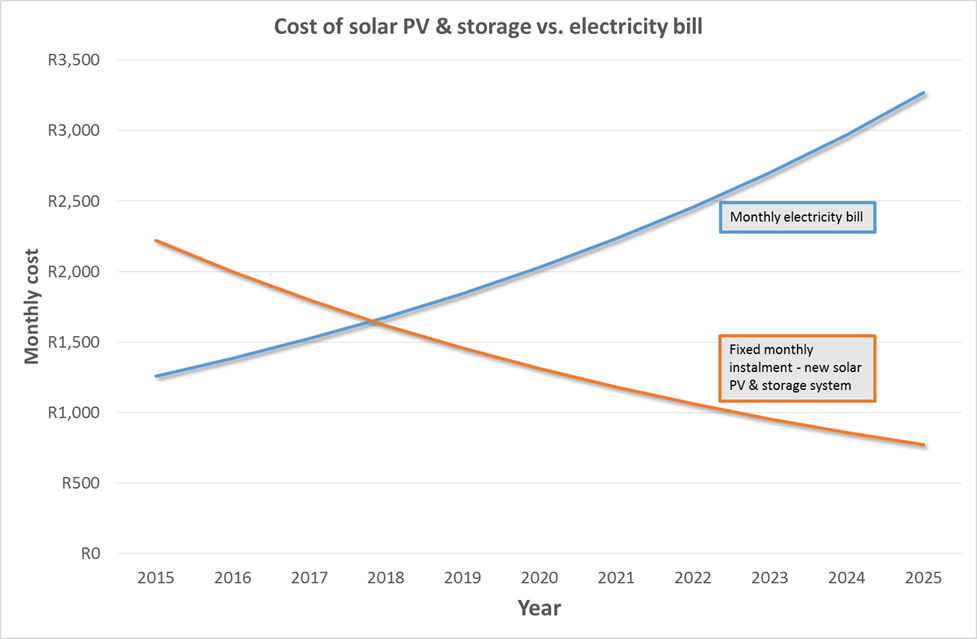
With the price of solar PV (photovoltaic) panels dropping by more than 10% per year, and Eskom seeking double digit increases for the foreseeable future, when can we expect to see the cost of residential solar PV and battery storage systems to drop below the cost of grid power from Eskom?
We did a simplified calculation to obtain an estimate of when this might happen… And it seems like it will start making financial sense for South Africans to switch within the next 3 years! Thereafter, the financial case for switching will just get stronger every year…
A major barrier to solar PV and battery storage systems is the upfront capital cost. But this could be financed by your bank, and you would be assured of a fixed electricity price for 20 years, compared to continually rising electricity costs if you are tied to the grid. Also, you would be completely free from loadshedding!
How we calculated:
We assumed a typical residential electricity usage of 900 kWh/month, at a current price of R1.40/kWh.
We estimated a current cost of a solar PV + battery storage solution to go off-grid at R200 000, plus an additional R30 000 for a solar geyser and gas oven.
We assumed a 10% increase in Eskom prices and a 10% decrease in solar PV + storage system prices per year. (This is conservative, as discussed above.)
We assumed a 20 year payback period and 10% interest rate on the loan to finance the solar PV + storage system.
Footnote: The graph plots the fixed monthly instalment that you would have to pay if you bought the system in the year as indicated. The instalments over the 20 year period would of course be constant. (So if you bought the system in 2015, fixed monthly instalment would be around R2 200/month over the 20 year period, whilst if you bought it in 2018, fixed monthly instalment would be around R1 600/month over the 20 year period.) Even if you bought the system right now (with the R2 200/month instalment), you will start saving by around 2020, meaning that for at least 15 years subsequently you will be paying less than what you would have if you were still on the grid (and every year the savings would increase due to the increasing price of electricity)…

